
REFLECT
Analysis
- Organise your data systematically
- Look for patterns in your data to help you answer your research questions
- Synthesise your data into categories and write summaries so you can share what you have found with others
Introduction
In this section you will consider your data using systematic techniques to develop understanding of what it can tell you in relation to your research question. Analysis can take a long time so we suggest two different ways of doing this, both of which will help you to navigate your data and draw meaning from it:
- If you only have a few hours to spend on your total action research project, we suggest that you complete Activity 1, which is a reflective practice exercise utilising your research evidence.
- If you have longer to spend on your action research, then follow the introduction to analysis we lay out in Activities 2-3. These activities will guide you through a simple data analysis and interpretation process based on our previous work with teachers.
The activities will guide you through analysing a range of qualitative and quantitative data. Our analysis process is led by a qualitative approach – that means we are giving priority to developing understanding of the specific teaching and learning situation that you are working in. Although this is often described as a ‘subjective’ approach (which means your own, situated interpretation of the data is important), it’s still very important to be rigorous, systematic, and to critically consider multiple perspectives – also called triangulation. This ensures your findings will be trustworthy and not just anecdotal.
It’s important to remember that data can be messy, contradictory, and complex: retain all of this in your analysis. To conduct a thorough analysis, you will need to take time to consider why contradictions might have arisen, stay specific rather than generalising, and make sure you don’t ignore data if it seems to contradict the idea you started with. Remember that you can learn as much from something that didn’t work as from something that did – risk taking is important in creativity!
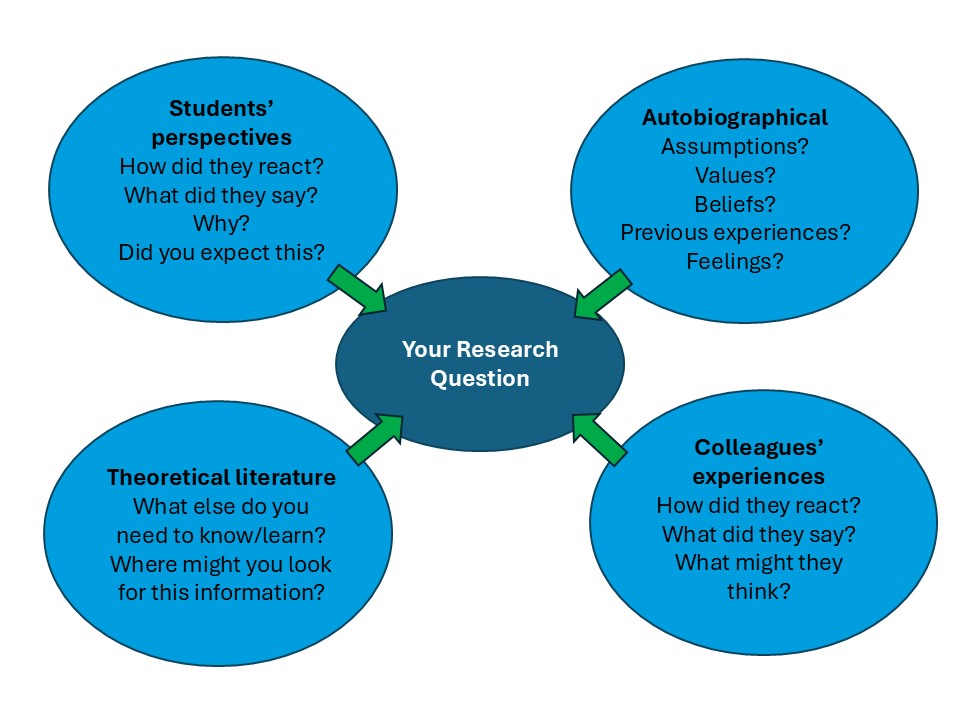
Activity 1: Using Brookfields’ Four Lenses to reflect on research data
This activity uses your research data to complete a reflection based on Stephen Brookfield’s ‘Four Lenses’ for critical reflection.
Brookfields’ Four Lenses:
(Brookfield, 2017)
Brookfield developed this approach to support teachers to be critically reflective by considering their teaching from multiple different perspectives. Download the Research Journal Critical Reflection Template to complete this activity.
- Remind yourself of your research question – insert it in the critical reflection template, and ensure that it is visible on your screen, or printed and placed on your desk throughout this activity. If you are using the Penryn Creativity Collaborative definitions of creative skills or creative pedagogies, it will also be useful to have these to hand.
- Assemble the data you have collected – this might be your own reflective notes on a lesson, an observation of student responses, some student work, etc, etc. You might want to actively prioritise what you see as the most important data source first, e.g. interviews with students. This will set the scene for your analysis of the other data sources that follow. Work through this data, and for each bit that is relevant to your research question, consider the ‘lens’ on your question that it contributes to – i.e. does it illuminate:
- your own autobiographical perspective (anything from your prior experiences, beliefs or assumptions that you bring to the experience in question),
- a student’s perspective,
- a colleague’s perspective,
- or a theoretical perspective (anything from the creativity module, literature or from policy documents)?
If you are following the 5 hour pathway: Instead of working with existing data, use the prompts in the Critical Reflection Template to support you to reflect on a lesson or event from four different perspectives, in relation to your research question. Have a conversation with your Dialogue Partner to complete the ‘colleagues’ experiences’ section. Draw on your notes from the Creativity Module to fill in the ‘theoretical perspective’ box. Now progress to the Reporting Module.
An example completed template is provided to support you in this activity.
- Copy the relevant data into the appropriate section of the template. NB – only include the data that is relevant to your research question.
- Return to your notes from the Understanding Creativity and Understanding Context modules. What perspective does this reading give on your research question? Make some comments on this in the ‘theoretical perspective’ section of the template.
- You may want to add more data at this point if you do not have something in each section of the template. Think about your own assumptions, values, beliefs, previous experiences and feelings to supplement the ‘autobiographical’ section. Make further notes on how students responded, what they said, and why they might have said this, to supplement the ‘student’ section. Ask a colleague (or your Dialogue Partner) for feedback, or to share similar experiences for the ‘colleagues’ experiences’ section.
- Return to your research question again and prepare a summary of how the data collected in each section of your template provides a perspective on this question. You can do this by filling in the summary boxes in the template, or you can integrate your critical reflection together into one response at this stage. These are your findings.
- Progress to the Reporting Module, to reflect on the implications of your findings for your practice.
Activity 2: Analysing your data
Complete this activity and the next one if you would like to conduct a full analysis of your data. We provide a short introduction to analysing word-based, visual and number-based data, based on our previous work researching creativity with teachers. Only use the section(s) of this activity you need for your own data.
Where possible, get input from your Dialogue Partner into this section: having multiple perspectives on the analysis helps to make it more rigorous and trustworthy. Keep notes on the approach you have taken and any analytical decisions you make in your Research Diary.
A reminder: Analysing data takes time! Be extremely selective about the data you work with: it is better to work in detail with a small amount of very relevant data than to try and include lots of only partially relevant data and find that you do not have time to reflect on it. A single lesson observation can yield very interesting findings if you take the time to analyse it carefully.
Analysing word-based data
This approach is suitable for any word-based data: transcripts of interviews or focus groups, observation notes, reflective diaries, blogs, transcripts of videos or vlogs, etc.
NOTE: You will need to transcribe any data you have audio/ video recorded before you can analyse it – this means writing down what your participants said word-for-word (i.e. not a summary or paraphrase). There are several AI auto-transcribers available online and built into software such as Word. You can also use Teams or another video conferencing software to audio record interviews and produce an automatic transcript. A professional transcriber will give you more accurate results if you have budget for this.
In this activity you are going to look for patterns of meaning in your data by splitting the data into small sections and putting the similar bits of data together into a series of categories that are relevant to your research question. Download the Research Journal Analysing Word-Based Data Template to complete this activity.
An example completed template is also provided to support you in this activity.
- First, remind yourself of your research question. If you are using the Penryn Creativity Collaborative definitions of creative skills or creative pedagogies, it will also be useful to have these to hand.
- Next, get to know your data really well: Read it all through more than once and while you are doing this, highlight the sections that are relevant to your research question, and to the creative skills / pedagogies that you are investigating. You might want to actively prioritise what you see as the most important data source first, e.g. interviews with students. This will set the scene for your analysis of the other data sources that follow.
- Now you are going to split the highlighted sections of data into separate categories – four or five categories in total:
- You can decide on your categories in advance, based on your research question. For example, if you are asking a question about creative skills, and you have decided to use the Penryn Creativity Collaboratives Creative Skills Framework, then you may like to use headings from the creative skills framework as your categories (dialogue and collaboration, honing and developing an idea, taking empowered action, being imaginative and playful, generating new ideas that matter).
- OR you can decide on your categories based on a combination of your research question and your data. If you take this approach, read through your data, making a note of themes that are relevant to your question and that come up repeatedly. Use these notes to define a series of 4-5 categories which are concise, descriptive, and relate to your research question.
Hint: make sure the categories you define are to do with meanings, rather than with types of data. For example:
‘Student responses’: this is a type of data, so it is not a suitable category
‘Assessing creative process vs creative product’: this is a concise description of the meaning of what has been said, so it could be a category.
- Use the downloadable Research Journal Analysing Word Based Data template to put your data into the separate categories that you have defined. You can do this by cutting and pasting the data into a table on your computer, or by literally cutting up a print-out of your data and putting the extracts of data into separate piles. Either way, make sure you are making a note of where the data comes from as you go along – you need to know who said what, when and where.
You can do this by putting a label in brackets after a piece of data (e.g. Int 2, Stud 3, p7 means the data came from the second interview, with student number 3 on page 7 of the transcript)
Leave the summary sections of the document blank for the moment: Pause before you move onto the summary sections of the template, we will come back to these in Activity 3. Before that, have a look at any other data you need to analyse using the steps below.
Analysing pictures
See, think, wonder is a simple but powerful thinking routine from Harvard Project Zero and a quick way of extracting meaning from visual data of all kinds. Use this approach for analysing students’ drawings or other creative artefacts, and for photos of students or teachers engaging in creative practice. It can also be adapted for analysing videos or student work.
- Remind yourself of your research question and definition of creative skills / pedagogies and select a photograph, drawing or object from your data that you want to analyse that is relevant to your question in some way.
- Download the ‘See, Think, Wonder’ Template, and interrogate your image / object by noting:
See – what do you see? This is an observation. Be as literal as possible, trying NOT to interpret in terms of e.g. creative skills at this first stage.
Think – what do you think is going on? This is an interpretation: Make sure you are using the evidence (what you can see) to support what you think is happening.
Wonder – what does this make you wonder? This uses your curiosity to consider the implications of what you have seen, in relation to your research question or to the creative skills/ pedagogies you are exploring.
- Have a look at an example of a completed ‘See think wonder’ analysis.
- You can now integrate your ‘see, think, wonder’ analysis into the categories you defined in your word-based data analysis: Copy and paste both the picture and your text into the relevant part of your Analysing Word Based Data Template.
Analysing numbers-based data
Action research tends to make limited use of numbers-based data, and in terms of analysis this is because most statistical analysis depends on larger numbers than you will be working with in your research. Having said that, using descriptive statistics can be helpful for quickly giving an overall picture of a situation, and for triangulating your more in-depth qualitative data.
- Use descriptive statistics to summarise the findings of your surveys by calculating:
- The distribution of the data (how frequently each response is given)
- The central tendency of the data (the average, given as mean, median, or mode)
- The variability of the data (how spread out the data are)
- All of these can be calculated by entering your data into an excel spreadsheet and using the basic calculations available.
Hint: if you are working with a small number of responses (e.g. 20 or fewer), it is better to report actual numbers rather than percentages, since percentages can imply a misleadingly significant answer.
- Summarise your quantitative data using a table, diagram or chart – bar charts and pie charts are often used for this purpose. This helps you to visualise your data as part of your analysis, and helps make it quickly understandable to others. Once you have created a chart, diagram or table of your quantitative data, add a sentence or two to explain what the chart is showing and how this relates to your research question.
- Now triangulate your data: Combine your quantitative data with your other data sources by copying and pasting both the analysed data and the explanatory sentences into the relevant categories you have defined in your Analysing Word Based Data Template
- For an example of how quantitative data can be used successfully in Action Research, see p. 5 of Alex Child’s AR Report, How does working on real-world projects lead to learners being powerful in their understanding?
Analysing other data
Some examples of how the above approaches may apply to other types data are as follows:
- Videos: there are lots of creative ways of working with video data. Due to the time this can take, we suggest the following options:
- Use a transcript of the audio from your video and incorporate this into your word-based data analysis.
- Complete an observation of your video using the observation method introduced in the Data Collection module. Build this into your Analysing Word Based Data Template
- Use stills or very short extracts from your video as the basis for a ‘see, think, wonder’ analysis (see analysing pictures, above).
- Student work / creative artefacts: there are a range of ways that you can incorporate student work into your analysis.
- Start by making it clear what it is about the work that relates to your research question/ to creative skills and pedagogies by writing a short explanation and / or annotating the work itself.
- Include the work itself and the explanation into the relevant category in your Analysing Word Based Data template.
- A ‘see, think, wonder’ approach is also a good way of including student work into your analysis: Take a photo of it, complete a ‘see, think, wonder’ template (see analysing pictures, above), and include both the photo and your analytic notes on it into your Analysing Word Based Data template.
- Creative skills wheel: if you have used the Penryn Creativity Collaborative creative skills wheel, then you may have already incorporated this into an interview, observation or written reflection approach which will have yielded some words-based data that you can work with, or you may have used the wheel as the basis for a survey which you can use to generate quantitative data. If you have printed wheels with observation notes written around them, then you can include these written notes in the relevant category in your Analysing Word Based Data Template. You may need to add detail to your initial notes to make these comprehensible – i.e. turning a short note into a complete sentence, or explaining what was going on when you made the note. The wheels are of limited value on their own as a quantitative tool, and we would caution against using them in this way.
Activity 3: Producing findings
You have now collected together data from a range of sources into a series of four-five categories, using your Research Journal Analysing Word Based Data template. The next job is to produce a short summary of how the data you have collected in each category provide insight into your research question. This is a good moment to have your definition of creative skills / pedagogies from the Creativity Module to hand, to refer to as needed. It may also be helpful to have the key points from your ‘Understanding the literature’ template nearby, as this can help you to shape your summaries.
- At the bottom of each category on your Analysing Word Based Data Template, you’ll find a ‘summary’ box. In here, write a short summary of how the data in this category provides insight into the question you are asking. This can be quite descriptive at this stage: Sentence starters (there is good evidence for….; there is mixed evidence for….) are provided in the template to help with this.
- Now, select 2-3 short pieces of data from everything you’ve collected in your template that exemplify the summary you’ve just written, and copy these into your summary boxes as well.
- These summaries are your findings. Together with your selected pieces of data, they will form the ‘findings’ section of your report, so you have now completed your analysis and also made a good start on reporting on your action research.
Further reading
Brookfield, S.D. (2017). Becoming a critically reflective teacher, 2nd edition. Jossey-Bass
Koshy, V. (2010). Action research for improving educational practice: a step-by-step guide (2nd Edition). SAGE. (Chapter 6, Analysing data).
NFER (2014). How to… Run qualitative and quantitative research.
FAQs
How do I know if my interpretation of the data is correct?
It is rarely the case that any single interpretation of the data is entirely ‘correct’. This is because creativity is a complicated concept, and lots of the data that relates to it is subjective, messy, and situated: multiple interpretations may have equal validity. This means that it is especially important here to be transparent about how you have analysed your data – what your data comprised, how you have gone about analysing it, what kinds of decisions you have taken. Keep notes on all of this in your Research Diary so you can report on it later. Preferably use data from multiple different sources, and gain input from more than one person into the interpretation – your dialogue partner is very helpful here, as is the perspective of existing published research. These steps will help you (and others) to have more confidence in the interpretations that you make.
Do I have enough data to draw conclusions?
This is another ‘how long is a piece of string’ type of question. Always be measured in the conclusions you draw, being specific about the context and scale of the research you have conducted. Sentence starters to help with this could be:
- Within the year 6 class participating in the project, there was a consensus that…
- The evidence suggests that…
- The data showed that my year 8 classes demonstrated PCC creative skill ‘dialogue and collaboration’ strongly when….